
The ELK stack has pretty much established itself as a must-have stack for searching and analysing data inside organisations that deal with high volumes of information every day.
But one of the features that the ELK stack does not natively have (at least without paying a lot of money) is an alerting system. And this is really important when you have a system that deals with big volumes of data because, typically, you need to know when something in your system starts to go wrong or does not behave as expected so that you can act as soon as possible.
To solve this problem Yelp developed ElastAlert and Elastic developed Watcher and in this post I will compare them according to my experience installing and using both.
Installation:
I will start from the assumption that you are using Docker to run the stack, if not I highly recommend you to start using it 😉 but obviously you don’t have to run it with docker.
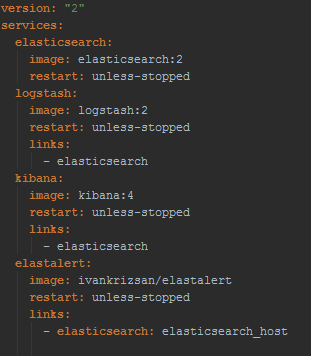
Installing both ElastAlert and Watcher is a pretty straightforward process. For ElastAlert you have a docker image with it already available on docker-hub. And basically, if you’re using Docker to run your ELK stack you just need to add this image as part of the stack and have a link to your elasticsearch container with elasticsearch_host as alias, something like this docker-compose file:
On the other hand, Watcher is installed as plugin for elasticsearch, so you just need to add the plugin installation to your elasticsearch dockerfile, something like:
RUN /usr/share/elasticsearch/bin/plugin install --batch watcher
To verify that watcher is correctly installed you can call the watcher stats API:
curl -XGET 'http://localhost:9200/_watcher/stats?pretty'
You should receive a response similar to:
{
  "watcher_state": "started",
  "watch_count": 0,
  "execution_thread_pool": {
    "queue_size": 0,
    "max_size": 0
  }
}
And that is basically it regarding installation. Watcher might have a slight edge here because is installed just as a plugin and you don’t have to add another image to your stack.
Creating alerts:
Watcher:
Configuring Watcher is really straightforward and you just need to tell watcher 3 things:
- A trigger and search input, i.e. how often will you query elasticsearch and the query itself
- A condition that when true will instruct watcher to take an action
- The action watcher will do when the condition is true
So imagine you want a watcher to periodically check your log data for error conditions, this is how the configuration would look like:
The trigger:
"trigger" : { "schedule" : { "interval" : "10s" }}
This trigger instructs Watcher to query elasticsearch every 10 seconds. The trigger is fully configurable and you can even use a cron expression.
The query:
"input" : {
    "search" : {
      "request" : {
        "indices" : [ "logs" ],
        "body" : {
          "query" : {
            "match" : { "message": "error" }
          }
        }
      }
    }
  }
This input will query the logs index in elasticsearch and search for messages where the message field is error. Obviously, you can add any elasticsearch DSL query in the body.
The condition:
"condition" : { "compare" : { "ctx.payload.hits.total" : { "gt" : 0 }}
This condition will be true if the query to elasticsearch returns any result.
The action:
"actions" : {
    "log_error" : {
      "logging" : {
        "text" : "Found {{ctx.payload.hits.total}} errors in the logs"
      }
    }
  }
This action will write a message in the elasticsearch log. But you have at your disposal a bunch of different actions you can take like send emails, call third-parties webhooks, etc.
Here is the full watcher configuration:
curl -XPUT 'http://localhost:9200/_watcher/watch/log_error_watch' -d '{
  "trigger" : { "schedule" : { "interval" : "10s" } },
  "input" : {
    "search" : {
      "request" : {
        "indices" : [ "logs" ],
        "body" : {
          "query" : {
            "match" : { "message": "error" }
          }
        }
      }
    }
  },
  "condition" : {
    "compare" : { "ctx.payload.hits.total" : { "gt" : 0 }}
  },
  "actions" : {
    "log_error" : {
      "logging" : {
        "text" : "Found {{ctx.payload.hits.total}} errors in the logs"
      }
    }
  }
}'
This is just a simple example, and you can do much more complex watchers, like having cascading inputs, where you can use the result of an input in another input, and much more.
ElastAlert:
Configuring ElastAlert is also very easy, you need to create a .yaml file for each alert and, similarly to Watcher, when you configure an alert you have to give ElastAlert a query to perform, parameters on what triggers a match, and a list of alerts to fire for each match. The only difference is that the trigger, i.e. when ElastAlert will query elasticsearch, is defined in a separate configuration .yaml file and this trigger will run all the alerts configured at the same time.
For example, this alert would do the exact same thing as the above, except this would send an email:
# From example_rules/example_frequency.yaml
es_host: elasticsearch.example.com
es_port: 14900
name: Example rule
type: any
index: logs
filter:
- match:
    message: "error"
alert:
- "email"
email:
- "elastalert@example.com"
es_host and es_port should point to the Elasticsearch cluster we want to query.
name is the unique name for this rule.
type: Each rule has a different type which may take different parameters. The any type means “Match everything. Every hit that the query returns will generate an alert”. For information other types, see Rule types.
index: The name of the index(es) to query. If you are using Logstash, by default the indexes will match “logstash-*”.
filter is a list of Elasticsearch filters that are used to filter results. Here we have a single match filter for documents with a messages field matching error. See Writing Filters For Rules for more information.
alert is a list of alerts to run on each match. For more information on alert types, see Alerts.
email is a list of addresses to which alerts will be sent.
Depending on the alert type, different properties need to be present in the alert. To read about all the alert types and respective properties follow this link.
ElastAlert is very configurable, so it’s very easy to define your own rule type, all you need to know is python. For more info on how to create your own rules follow this link.
Also, like Watcher, ElastAlert saves all its state back to elasticsearch, so even if you stop and start ElastAlert it will know the last time it ran, so you don’t get repeated alerts.
CRUD operations
In both cases, doing CRUD operations is very easy, although Watcher gets a small hedge because it comes with an API straight out of the box. You can just simply do Get, Post and Delete Http requests to get, create, update and delete watches.
In the case of ElastAlert, you need to create a .yaml file and place it under a certain folder where ElastAlert is installed every time you want to create an alert. Fortunately, someone already took the time to develop an API for ElastAlert, and you can follow this link to see it. The good thing is that is written in javascript so it’s very easy to “dockerize”, and you can then deploy it with your ELK stack.
Conclusion
Both alerting systems are good and can deal with most of the alerting scenarios out of the box.
Obviously, Watcher is paid and ElastAlert is free. So if your company already has a paid license for elasticsearch I recommend going with Watcher, as it seamlessly integrates with the elastic stack. If not, and be aware that elasticsearch does not sell Watcher as a standalone product, so you will be required to get it as part of a (very) expensive package, then go with ElastAlert, which is a very good product and out of the box can even deal better than Watcher for a lot of scenarios.

Thanks Vitor – this is a great tip with good, clear examples. It solves one of the big behavioural problems with ELK, which is that you might have a great dashboard, but it still needs someone to go and look at it!
LikeLike